Data from each individual reporting segment (daily trend, age, gender, device, etc.) can be conveniently downloaded as a comma-separated values (CSV) file right from your reporting dashboard, just like in the example below: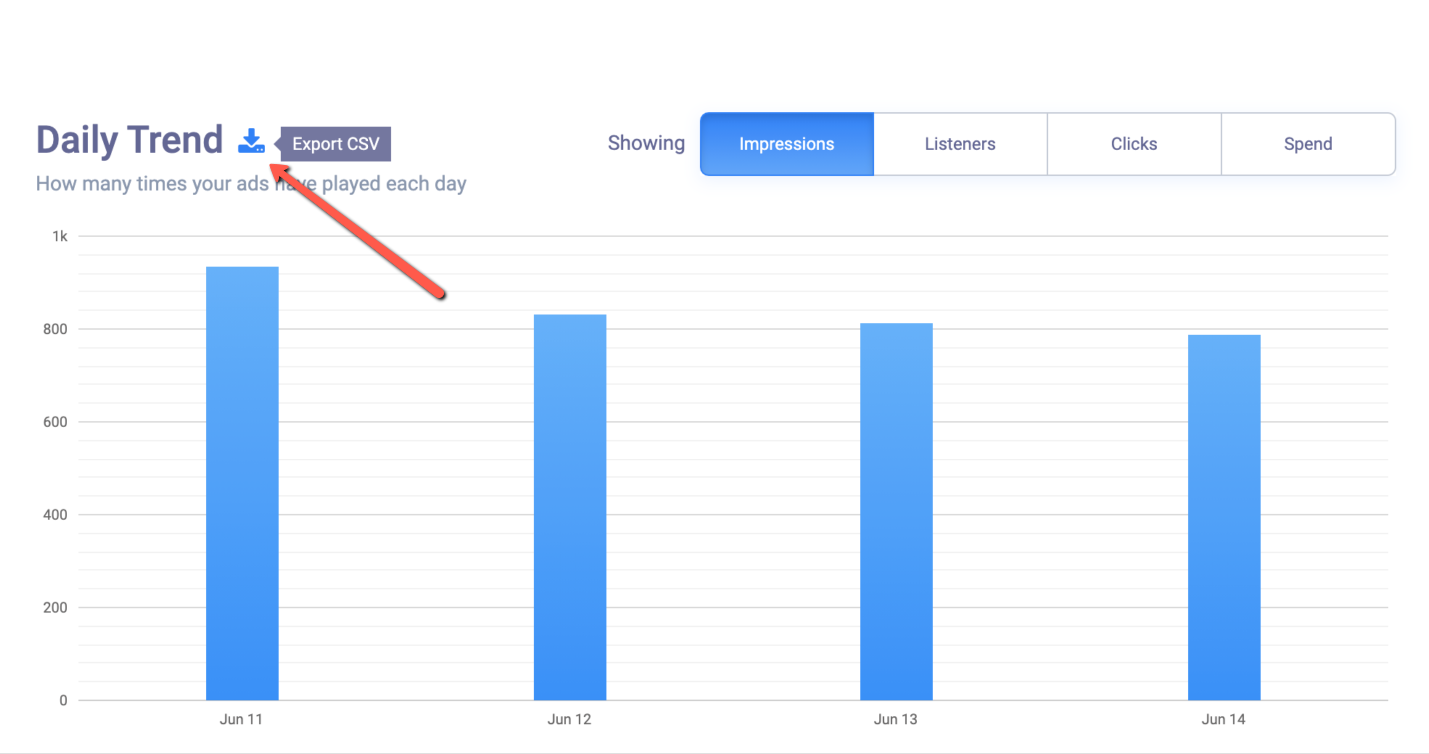
This action will generate a .CSV file which is immediately available for download. Then, you can use this file for any data processing you may need in your favorite spreadsheet editing application (Microsoft Excel, Apple Numbers, Google Sheets, etc).
Please note that due to the nature of the various report widgets, the functionality may slightly differ from one segment to another. For example, the daily trend chart will download all data - plus some more metrics only available in the export - as part of a single file, while other reports, such as the location report will need to be downloaded separately for each matching dimension, such as states, cities, or zip codes.
Data within each individual file is limited to a number of maximum 100 entries. The remainder - if any - will be aggregated under an "other" line or column.
Which metrics are part of the exported daily trend?
As part of the daily trend report file, you will notice a few extra metrics that are currently not available in the UI reports. These are meant to help you better understand campaign performance and optimize accordingly. The metrics are:
- Unique Listeners
- Audio Impressions
- Companion Impressions
- Display Retargeting Impressions
- Companion Clicks
- Display Retargeting Clicks
- Total Clicks
- Audio Spend
- Display Retargeting Spend
- Total Spend
Also note that the PDF export functionality is still available via the top menu item of your dashboard.