The Agency Playbook: Your Guide to Simpler, Smarter Audio Advertising
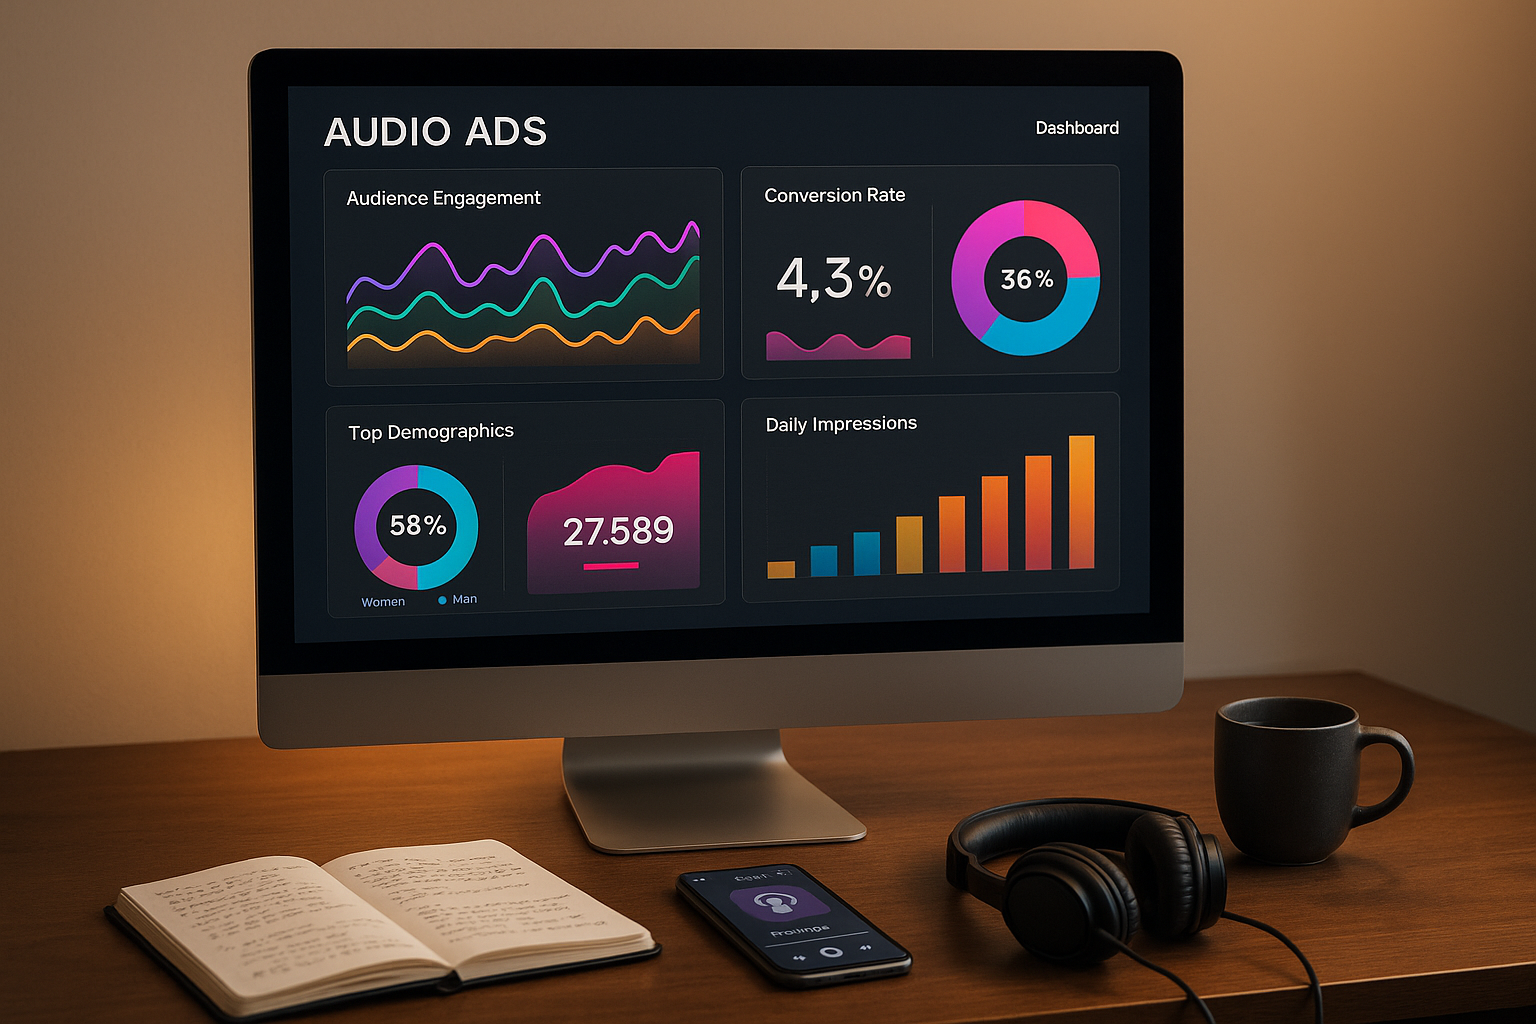
Far-reaching. Fast-growing. Attention-grabbing. Highly-effective. The numbers alone are reason enough to double down on digital audio advertising. ...
by AudioGO Team
• 3 min read
Far-reaching. Fast-growing. Attention-grabbing. Highly-effective. The numbers alone are reason enough to double down on digital audio advertising. ...
by AudioGO Team
• 3 min read
by AudioGO Team
• 7 min read
• 6 min read
by AudioGO Team
• 18 min read
by AudioGO Team
• 3 min read
by AudioGO Team
• 3 min read
by AudioGO Team
• 17 min read
by AudioGO Team
• 3 min read
by AudioGO Team
• 6 min read
by AudioGO Team
• 21 min read
by AudioGO Team
• 2 min read
by AudioGO Team
• 3 min read
by AudioGO Team
• 8 min read
by AudioGO Team
• 8 min read
Complete your account with details about your company
You're minutes away from creating your first
audio advertising campaign
Create a new account
AudioGO can't load if you're using an ad blocker. Please disable it and refresh the page to continue.
ReloadLoading...
Loading...